Flow Cytometry Gating
Related articles
Secondary antibodies resources
Alexa Fluor secondary antibodies
Biotinylated secondary antibodies
Enhancing Detection of Low-Abundance Proteins
9 tips for detecting phosphorylation events using a Western Blot
Western Blotting with Tissue Lysates
Immunohistochemistry introduction
Immunohistochemistry and Immunocytochemistry
Immunohistochemistry troubleshooter
Chromogenic and Fluorescent detection
Preparing paraffin-embedded and frozen samples for Immunohistochemistry
What is Flow Cytometry gating?
Gating is an important part of any flow cytometry experiment. This method is used to isolate and analyse specific cell populations within a complex sample based on measurable characteristics such as size, granularity, and fluorescence. During a flow cytometry experiment, cells are passed in single file through a laser beam, and detectors measure their light scattering and fluorescence signals.
Gating involves drawing "regions" on graphical plots—typically dot plots or histograms—to define subsets of cells that share particular features. These plots display parameters such as forward scatter (FSC, related to cell size), side scatter (SSC, related to cell granularity), and fluorescence intensity from labeled antibodies or dyes, in order to examine and quantify target populations.
The gating process is usually sequential:
- Initial Gates: Exclude debris and cell aggregates using FSC vs SSC plots.
- Viability Gate: Remove dead cells using viability dyes.
- Lineage or Marker Gates: Select specific cell types based on surface or intracellular markers.
- Subpopulation Gates: Further refine to study activation states, cytokine production, or other functional markers.
Gating is critical for ensuring data accuracy and reproducibility, allowing researchers to focus on biologically relevant populations and extract meaningful insights from complex datasets.
It is best to obtain as much information about the cells you will be observing and the controls and markers used prior to the start of your experiment. One way to do so is to estimate the size and granularity of the cells and how these parameters can change over the course of the experiment due to apoptosis, intracellular staining, or fixation.
By adding a negative control, you can easily set up a negative gate and observe only the real populations, which further simplifies the experiment.
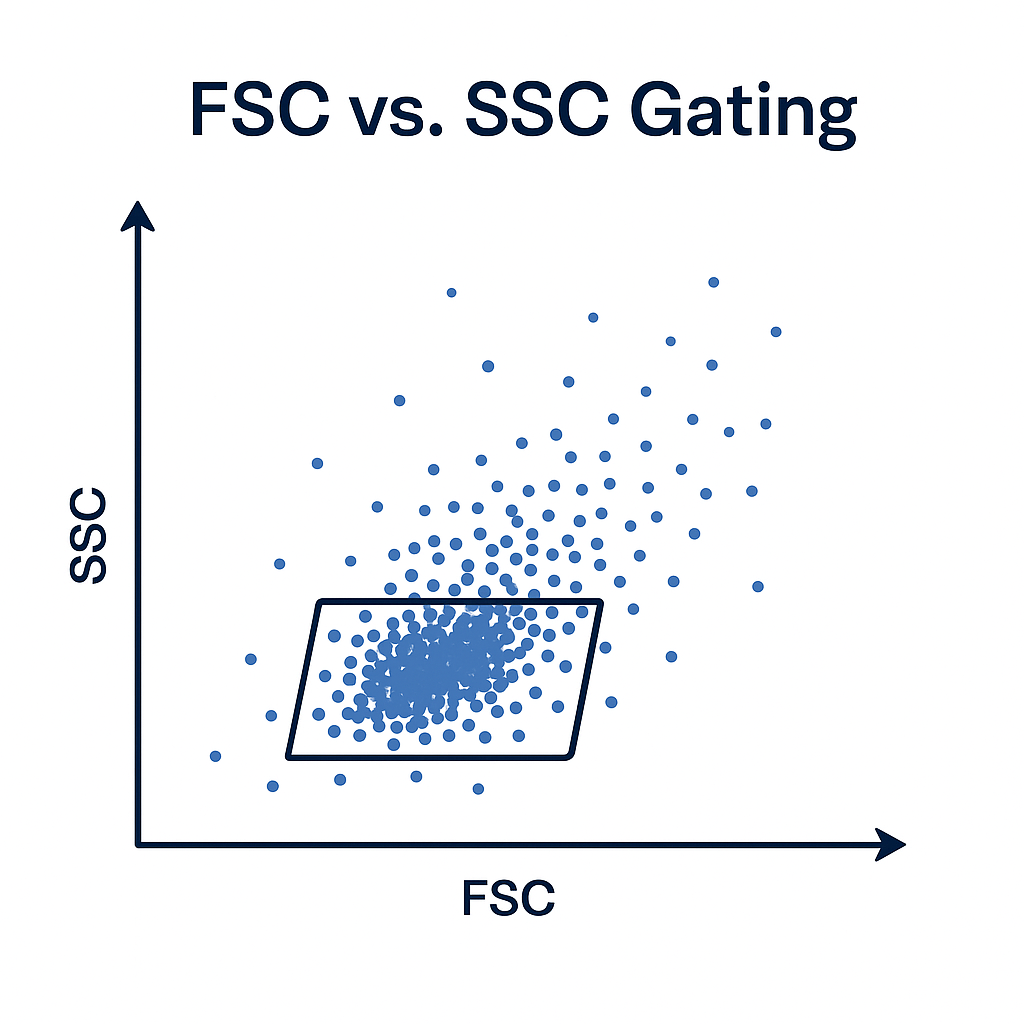
Initial Gating FSC vs. SSC in Flow Cytometry
Gating on Forward Scatter (FSC) versus Side Scatter (SSC) distinguishes cell populations based on physical characteristics.
FSC correlates with cell size, and larger cells will scatter more light in the forward direction.
SSC reflects cell granularity or internal complexity, and more granular or complex cells (e.g., granulocytes) scatter more light to the side.
By plotting FSC against SSC on a two-dimensional dot plot, distinct populations, like lymphocytes, monocytes, and granulocytes, will form recognizable clusters. Drawing gates around these clusters has the benefit of:
- Excluding debris (low FSC and SSC),
- Eliminating doublets or aggregates (unusual FSC/SSC profiles),
- And, isolating the population of interest for further gating based on fluorescence markers.
This FSC vs. SSC gating step is critical for improving data quality by ensuring only relevant, single-cell events are included in downstream analyses.
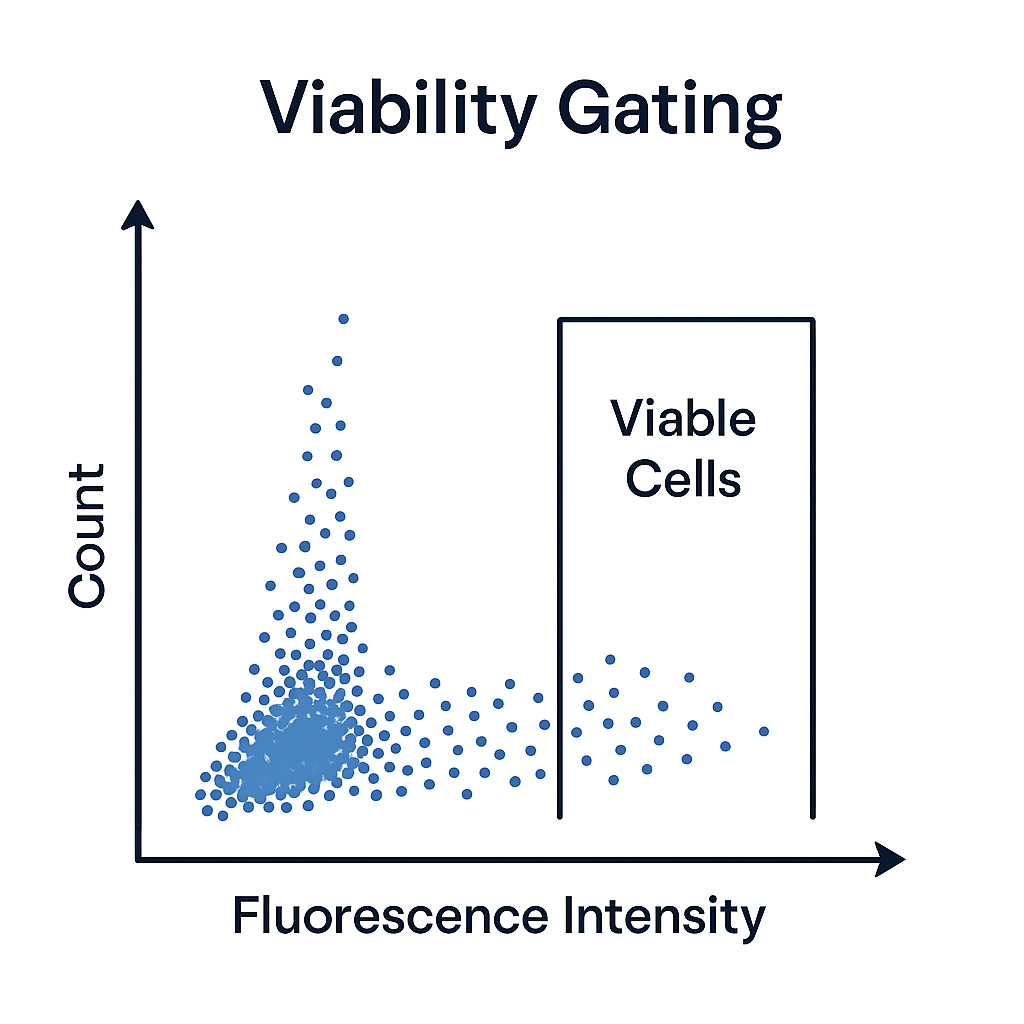
Viability Gating in Flow Cytometry
Viability gating distinguishes live cells from dead or dying cells within a sample. This process ensures that only healthy, biologically relevant cells are included in downstream analyses, improving both accuracy and reproducibility.
Dead cells often exhibit:
- Increased autofluorescence,
- Non-specific binding of antibodies,
- And disrupted membranes, which can skew data.
To address this, viability dyes are used. These dyes penetrate only cells with compromised membranes (i.e., dead cells), where they bind to DNA or proteins and emit a distinct fluorescent signal. Live cells exclude the dye, showing minimal or no fluorescence.
By plotting the fluorescence intensity of the viability dye on a histogram or dot plot, you can easily gate out the dead cell population and retain only the viable cells for further analysis. This step is particularly important in studies involving activation markers, cytokine production, or intracellular staining, where dead cells could introduce artifacts or false positives.
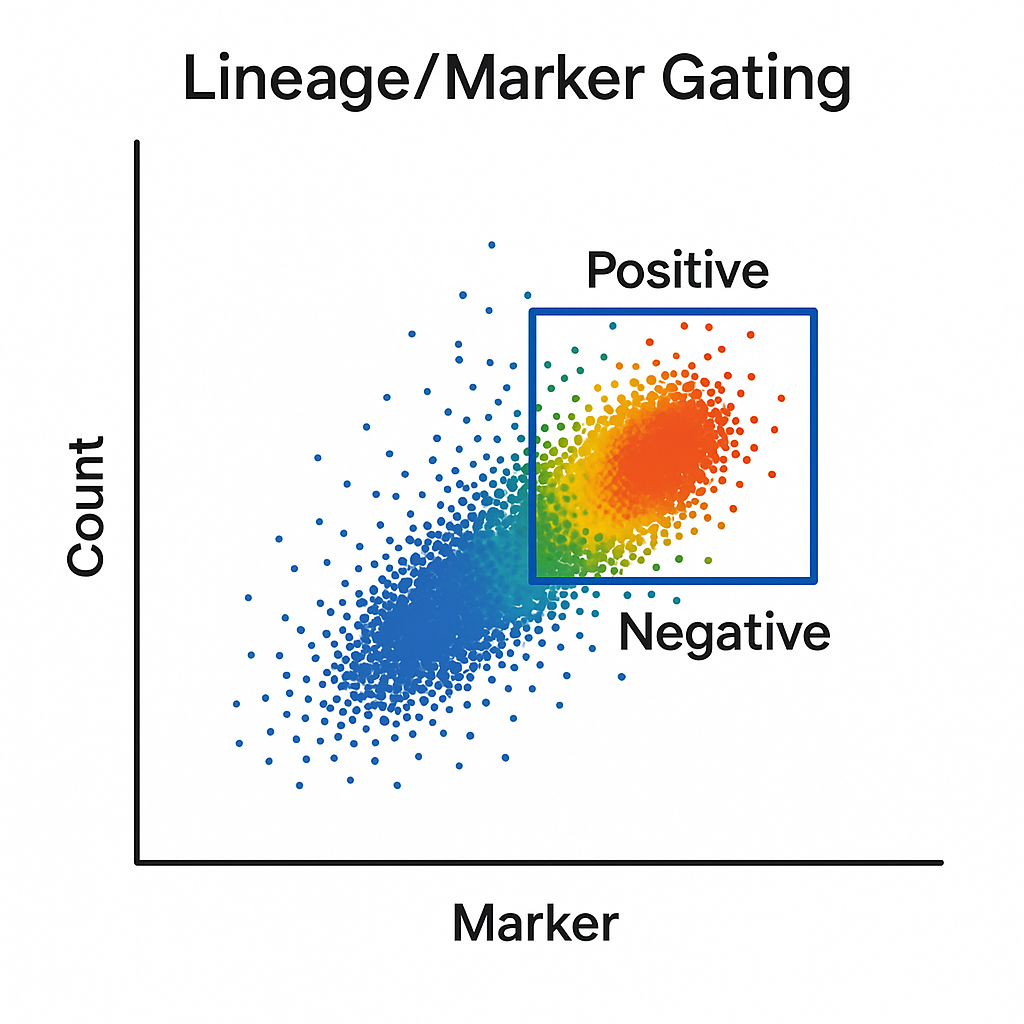
Lineage/Marker Gating in Flow Cytometry
The lineage/marker gating process identifies and isolates specific cell types based on the expression of surface or intracellular markers. These markers are detected using fluorochrome-conjugated antibodies that bind selectively to proteins characteristic of particular cell lineages or states.
For example, CD3 antibody is commonly used to identify T cells, CD19 antibody for B cells, and CD14 for monocytes. By plotting the fluorescence intensity of these markers on dot plots or histograms, you can define gates around positive and negative populations.
This gating step allows researchers to:
- Distinguish specific immune cell types within mixed populations,
- Track changes in marker expression under different conditions (e.g., activation or disease),
- And isolate subpopulations for functional assays or downstream analysis.
Lineage/marker gating is essential for high-resolution immunophenotyping, enabling detailed characterization of complex samples such as peripheral blood, bone marrow, or tumor infiltrates.
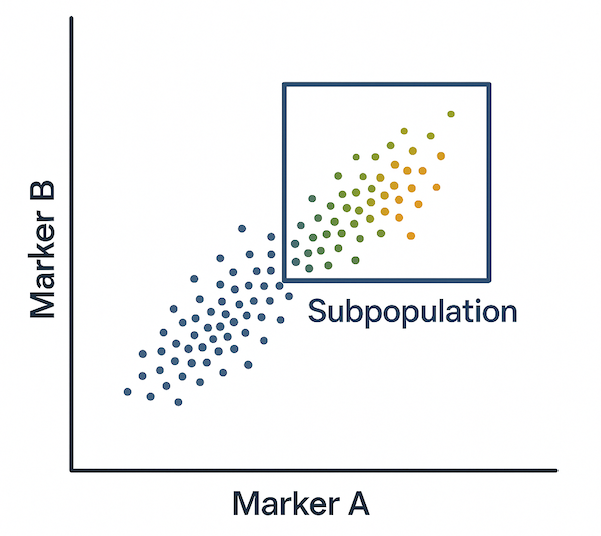
Subpopulation Gating in Flow Cytometry
After the other gating processes have been applied (e.g., FSC vs. SSC, viability, and lineage markers), subpopulation gating isolates smaller, more specific groups of cells based on additional marker expression.
Subpopulation gates are typically applied using multi-parameter plots, such as dual-color dot plots or overlay histograms, where cells are further separated based on combinations of surface or intracellular markers. These markers may indicate:
- Activation state (e.g., CD69, CD25)
- Functional subsets (e.g., Th1 vs. Th2 T cells using cytokine profiles)
- Developmental stages (e.g., stem cell differentiation using CD34, CD38)
- Proliferation or apoptosis (e.g., Ki-67, Annexin V)
This level of analysis enables researchers to:
- Assess cell behavior and function under various conditions,
- Quantify responses to treatments or stimuli,
- And track dynamic changes in the immune system or disease progression.
Accurate subpopulation gating requires careful control selection, appropriate compensation for fluorochrome overlap, and logical gating hierarchies. This step is essential for high-dimensional flow cytometry studies, particularly in immunology, oncology, and stem cell research.
References
Herzenberg, L.A., Tung, J., Moore, W.A., Herzenberg, L.A. and Parks, D.R. (2006) Interpreting flow cytometry data: a guide for the perplexed. Nature Immunology, 7(7), pp.681–685. https://doi.org/10.1038/ni0706-681
Saeys, Y., Van Gassen, S. and Lambrecht, B.N. (2016) Computational flow cytometry: helping to make sense of high-dimensional immunology data. Nature Reviews Immunology, 16(7), pp.449–462. https://doi.org/10.1038/nri.2016.56
Aghaeepour, N., Finak, G., Dougall, D., Khodabakhshi, A.H., Mah, P., Obermoser, G. et al. (2013) Critical assessment of automated flow cytometry data analysis techniques. Nature Methods, 10(3), pp.228–238. https://doi.org/10.1038/nmeth.2365
Cossarizza, A., Chang, H.D., Radbruch, A., Akdis, M., Andrä, I., Annunziato, F. et al. (2021) Guidelines for the use of flow cytometry and cell sorting in immunological studies (third edition). European Journal of Immunology, 51(12), pp.2708–3145. https://doi.org/10.1002/eji.202170126
Maecker, H.T. and Trotter, J. (2006) Flow cytometry controls, instrument setup, and the determination of positivity. Cytometry Part A, 69A(9), pp.1037–1042. https://doi.org/10.1002/cyto.a.20333
Finak, G., Perez, J.M., Weng, A. and Gottardo, R. (2015) Optimizing flow cytometry analysis for single-cell applications. Nature Protocols, 10(2), pp.206–219. https://doi.org/10.1038/nprot.2015.008
Pyne, S., Hu, X., Wang, K., Rossin, E., Lin, T.I., Maier, L.M. et al. (2009) Automated high-dimensional flow cytometric data analysis. Proceedings of the National Academy of Sciences, 106(21), pp.8519–8524. https://doi.org/10.1073/pnas.0903028106